
For the past couple of years, my friend and collaborator Aaron Zernack�has been investigating audio�synthesis using Current Voltage (CV/Gate) modular synthesizers. The whole thing has been very interesting to me aesthetically as sound, but also as to wonder about its potential in visualization. I have 2 modules now that allow me to experiment with analog synthesis in the visual realm. One is the Gieskes Oscillatoscope video synth and the other is the Minigorille Geometry Synth. Both of these devices have been an amazing ways of visualizing sound data�and creating very exciting synesthesia art projects. However, I noticed that a lot of these synths use ATMega chips, same or similar to the arduinos. This made me think in a more conter-intuitive way. What if I could get rid of all the coding and produce synthesizers that modulate current voltage using simple electronics?

The diagram shows a snapshot of a circuit simulator of an LED fader using the 555 timer, resistors and capacitors. As you can see on the graphic we should have a smooth PWM modulation, but it ends up ramping up really fast. The video shows how the circuit is not really able to keep a consistent value, or a slow gradation of value at the least. Anyhow, This is mostly a new venue for research and experimentation. It would be really cool to simplify the circuits for my sculptures and not necessarily need to use I/0 boards for each sculpture. In this case you can see how the Red�color fades in and then very suddenly it becomes white. I was hoping for a smoother transition, but nevertheless, very interesting.
Exploring 555
ISEA 2013

I arrived to Sydney a few days ago for the ISEA. Before the conference starts on Tuesday, the event has a series of workshops with an electronic arts focus. I gave my workshop “Sensing for Visualization” yesterday �and will repeat it today at 3 PM. The idea was to create a programming crash-course for physical computing. The workshop covered Processing and the Wiring board. It was cool to put the idea to a test with participants. The workshops occur at the College of Fine Arts of UNSW.
You can download the file with the workshop here
I was interested on teaching the Wiring board in the context of the Latin American Forum of the ISEA and to give information about this seminal project that preceded Arduino developed by the Colombian artist/designer Hernando Barrag�n. Hernando was a professor while I did my art undergrad in Bogot� at Universidad de los Andes, were he still teaches.
There are a lot cool things going on. Right now I at a workshop named SurSouth, an online collaborative conversation. It was great to reconnect with an old friend, Hamilton who now lives in London. His work is pretty cool. His objects are living organisms that exist through alchemy and technology. Check his stuff here
There we be a lot coming up. I’ll try to document other experiences of this trip. There is too much going on.
Workshop and Paper in ISEA 2013
![]()
My workshop “sensing for visualization” and paper “Stretch” were selected for the next ISEA 2013 in Sydney. Good news to start the year.�The workshop introduces the use of analog sensors to produce interactive experiences. Using inexpensive microcontrollers, components and open software, participants will prototype electronic boards to read meaningful data from the environment. The sensors can be affected by the light, the orientation, or a user�s physical input. I’ll be using the Wiring microcontroller.
Experiencia Mistica
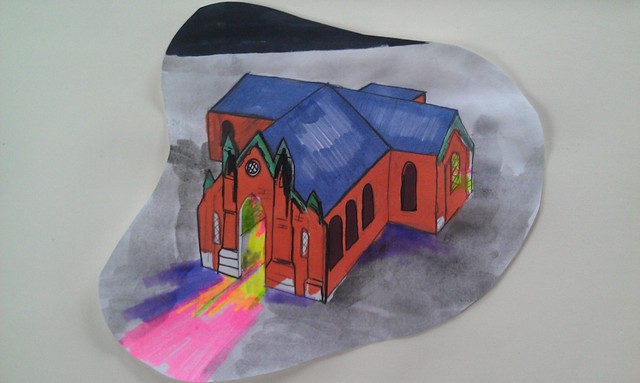
First sketch with the idea.
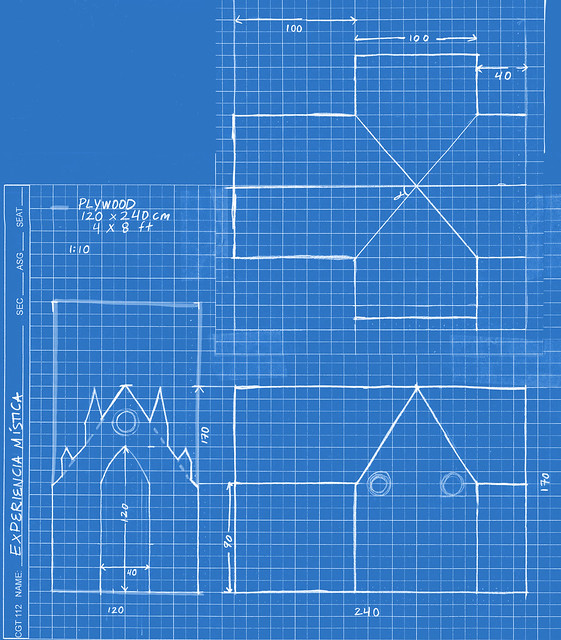
Okay, so I have embarked in a project that involves a lot of work, research and skill. A lot of people have seen me working at foamcity in a “church” or “castle”, but in reality is my Experiencia Mistica project. My motivation to do this project is an image that came to me a long time ago. This image is a three dimensional model of one of Lafayette’s churches. After that I started thinking about the most appropriate material to do a huge 3D model and after making 2 giant plywood structures in December, I went for plywood for this project. I have been obsessed with geometry for a while and during my PhD I’ve been exposed to visualization techniques and geometric modeling. I also teach a visualization class and Dr. Miller’s orthographic teachings came in very handy in the development of the model:
Max helped a ton with his knowledge and tools and we put together the main geometry in only 2 days! It was great. Now I am in the process of painting the outside and it’s been already a month of heavy work. This is how it looked last week:
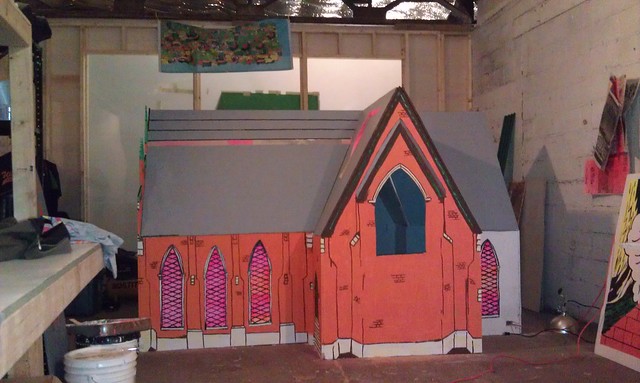
Since then I have repainted a lot of the early lines because I was not happy with the way the geometry looked kind of flimsy. The video on top shows a program for controling the lights inside via arduino. There is so much to be done!
Read values from a 203CE accelerometer directly in Processing

1. Upload the �standardFirmata� example from the Arduino IDE in your Arduino board. If you are using Arduino UNO, there is a standard firmata for UNO.
2.Install Arduino library for processing in your libraries folder in the processing sketchbook
3.Test the following code for the Led blink to test that Arduino and processing are communicating correctly (code from the arduino playground page):
import processing.serial.*;

import cc.arduino.*;
Arduino arduino;

int ledPin = 13;
void setup()

{

//println(Arduino.list());

arduino = new Arduino(this, Arduino.list()[0], 57600);

arduino.pinMode(ledPin, Arduino.OUTPUT);

}
void draw()
{
arduino.digitalWrite(ledPin, Arduino.HIGH);
delay(1000);
arduino.digitalWrite(ledPin, Arduino.LOW);
delay(1000); �����}
DEBUG.Try the analog read program in the arduino and use the serial monitor to see the maximum and minumum values of the accelerometer. You can take my word that they will be from 300 to 700. Supposedly should be (0-1023) in analog read with mid values around (500).
4. If the LED in the Arduino blinks it means that your �hello world� between the Arduino firmata and processing is working.
5.Build the circuit: (Connect to A0 for Y and A1 for X) in diagram it says 6 and 7, but it should be an analog pin.


import processing.serial.*;

import cc.arduino.*;

Arduino arduino; //creates arduino object

color back = color(64, 218, 255); //variables for the 2 colors

int xpin= 0;

int ypin= 1;

float value=0;

PImage a;

void setup() {

size(800, 600);

arduino = new Arduino(this, Arduino.list()[0], 57600); //sets up arduino

a = loadImage("mar.png");

arduino.pinMode(xpin, Arduino.INPUT);//setup pins to be input (A0 =0?)

arduino.pinMode(ypin, Arduino.INPUT);

}

void draw() {

background(back);

noStroke();

image(a,arduino.analogRead(xpin)-180, arduino.analogRead(ypin)-300); // in case you want to draw an image

//ellipse(arduino.analogRead(xpin)-130, arduino.analogRead(ypin)-130,30, 30); // in case you want an ellipse

}
–This program tracks down the X and Y values from the accelerometer and displays them altering the position of a graphic in the screen.
–You�ll need to replace the image mar.png in the data folder.
–The position of the object needs to be calibrated to the min and max values the accelerometer is giving you through the serial monitor and for this reason I substract 180 and 330 to the position of the graphic. It still needs improvement!

Interactive Random Chromatic Experience
I just stumbled upon the amazing Cruz-Diez foundation site. If I ever visit Houston I have to check this place out. My early assumptions about a connection between the kinetic / OP art movement from the late 1950s and the first experiments in computer art were finally proved through the “New Tendencies / Nuevas Tendencias” international movement. Cruz-Diez participated in some of the New Tendencies exhibitions in Zagreb, a melting pot for artists working with technology. I don’t think that there is somebody else that can understand the physical qualities of color as Cruz-Diez. His paintings produce visual effects as you walk through them. It an absolutely amazing experience. We find in his work, elements of interactivity, perception and science used for the purpose of creating amusing art. It is wonderful to think that the viewer doesn’t need to be an expert in art with MFA’s and/or PhD’s to understand this work.
Anyhow, The Cruz-Diez foundation has just launched an “app” called Interactive Random Chromatic Experience for iphone and ipad to create optical and colorful images in the style of Cruz-Diez. It is a new version of a 1995 CD-rom that I would love to have:

This project is a good demonstration of the research aspects present in Cruz-Diez work. In the computer screen, color is data and interacting with the software allows the user to manipulates the values of the program.
I’ve been toying with the idea of making an app that reconstructs “FIELDS,” the software created by Giorgini in 1975. Maybe this would be a good way of making his work accessible to the new generations?